Our strategy development and testing pipeline has produced a large library of alphas: trading ideas implemented in code and tested on historical data. The next question is how to turn that library into a portfolio and allocate capital. This requires looking at how strategies behave together. Two approaches with strong individual results may share both their profitable periods and their drawdowns.
We use one AIQ portfolio (September 2026) to explain the process. We rebuild the portfolio every month, starting with an updated pool of candidates. As the research pipeline adds newly tested strategies to the library, the set available for selection changes too.
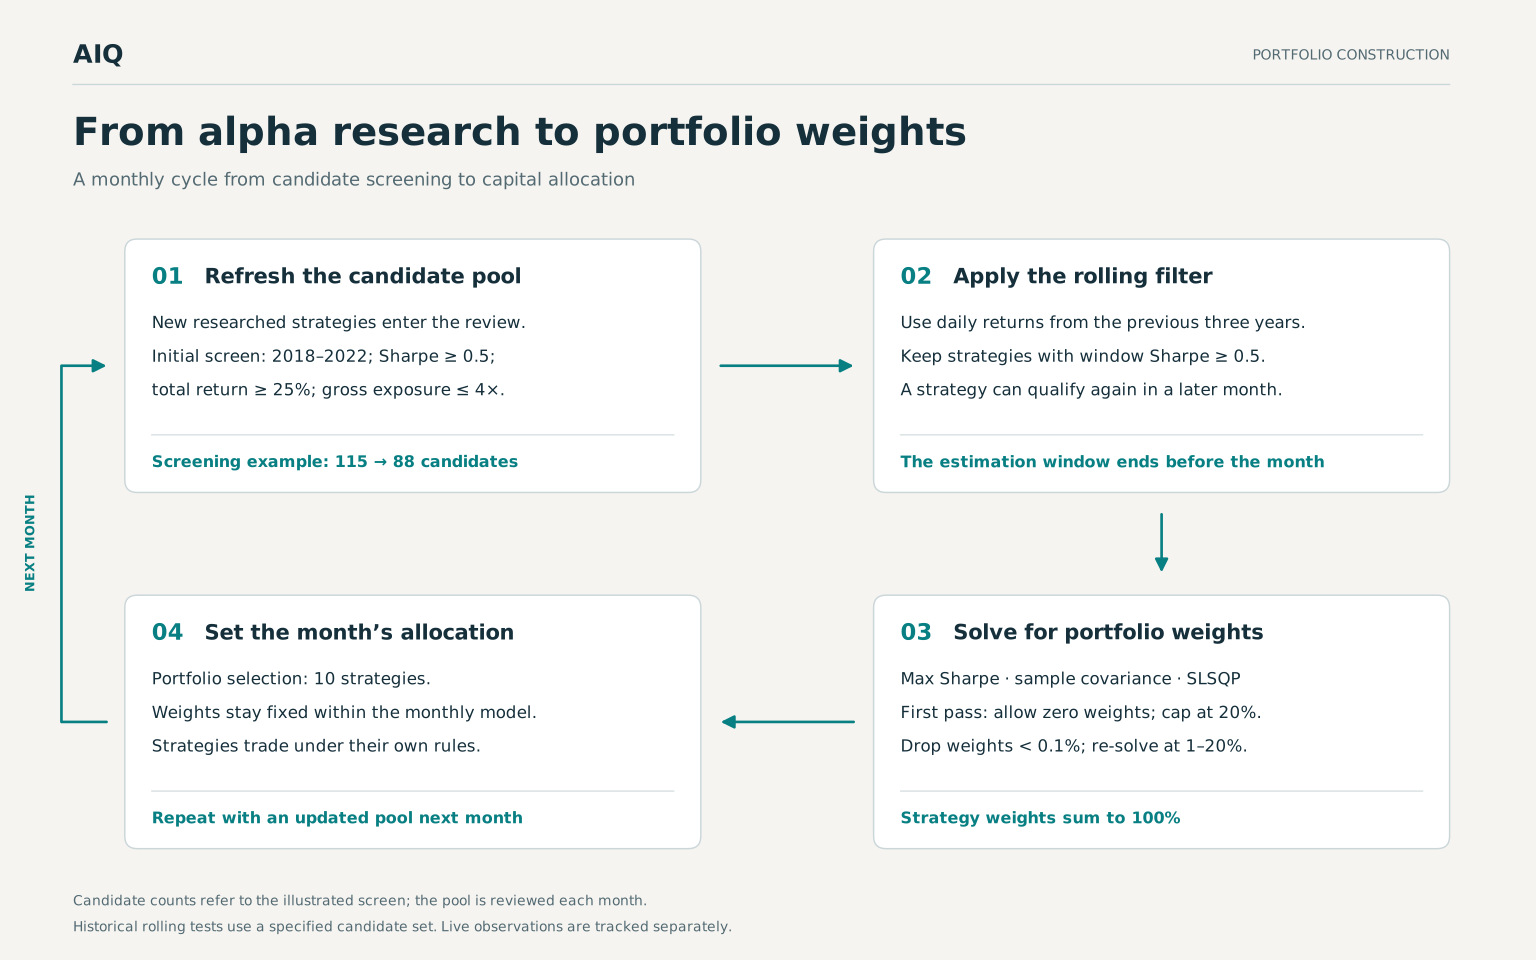
In this example, the initial screen uses backtests covering 2018–2022. To qualify, a strategy must have a Sharpe ratio of at least 0.5, a total return of at least 25% over the full period, and maximum gross exposure no greater than four times its allocated capital. The backtest results include commissions.
A total of 115 strategies passed these numerical criteria. After reviewing their instruments, categories and trading logic, we retained 88 candidates. The others were excluded because they did not meet the portfolio's requirements or had implementation errors.
For each candidate, we compile a daily return series over the required period, rerunning its backtest where necessary. We then align the returns by date. These series show which strategies made and lost money at the same time and provide the data for estimating their relationships.
The next screen uses a rolling three-year window. For each monthly allocation, we take the three years ending before that month begins. A strategy with a Sharpe below 0.5 over this window is excluded from that month's optimization. It can return a month later if it passes the screen again.
The two screens serve different purposes. Results for 2018–2022 determine admission to the candidate pool; the more recent three-year history determines eligibility for a particular monthly calculation. As the window advances, the oldest month drops out and a new one enters. We then re-estimate returns, volatility and covariance.
For this allocation, we use mean–variance optimization to maximize the Sharpe ratio: Max Sharpe. We estimate mean returns and the sample covariance matrix from daily data, annualizing both on the basis of 252 trading days. The model assumes a zero risk-free rate.
We solve the constrained optimization problem numerically using SLSQP. It searches for the capital allocation with the highest ratio of estimated portfolio return to volatility. The covariance matrix matters because it captures how the strategies' risks combine.
The strategy with the highest individual Sharpe therefore does not necessarily receive the largest allocation. If its returns closely track those of other portfolio strategies, allocating more capital to it increases exposure to a shared source of risk. A strategy with a lower Sharpe may contribute more to the portfolio if its returns are less closely related to the rest.
We optimize in two stages. The first allows zero weights and caps each strategy at 20%. We discard allocations below 0.1%, then optimize the remaining strategies again with weights constrained to between 1% and 20% each. Weights are nonnegative and sum to 100%. The number of strategies is an outcome of the calculation; we do not set it in advance.
A weight represents the share of capital allocated to a strategy. How much of that capital is actually in the market depends on its trading rules. A strategy may leave some capital unused or hold no positions for a time. A 10% allocation, for example, does not mean that the entire amount is continuously invested.
The portfolio contains ten strategies. Its five largest clusters account for the following shares of allocated capital:
Cluster | Share of allocated capital |
|---|---|
Event Driven | 20.00% |
Momentum | 19.15% |
Calendar Seasonality | 14.31% |
Portfolio Construction | 13.33% |
Mean Reversion | 11.08% |
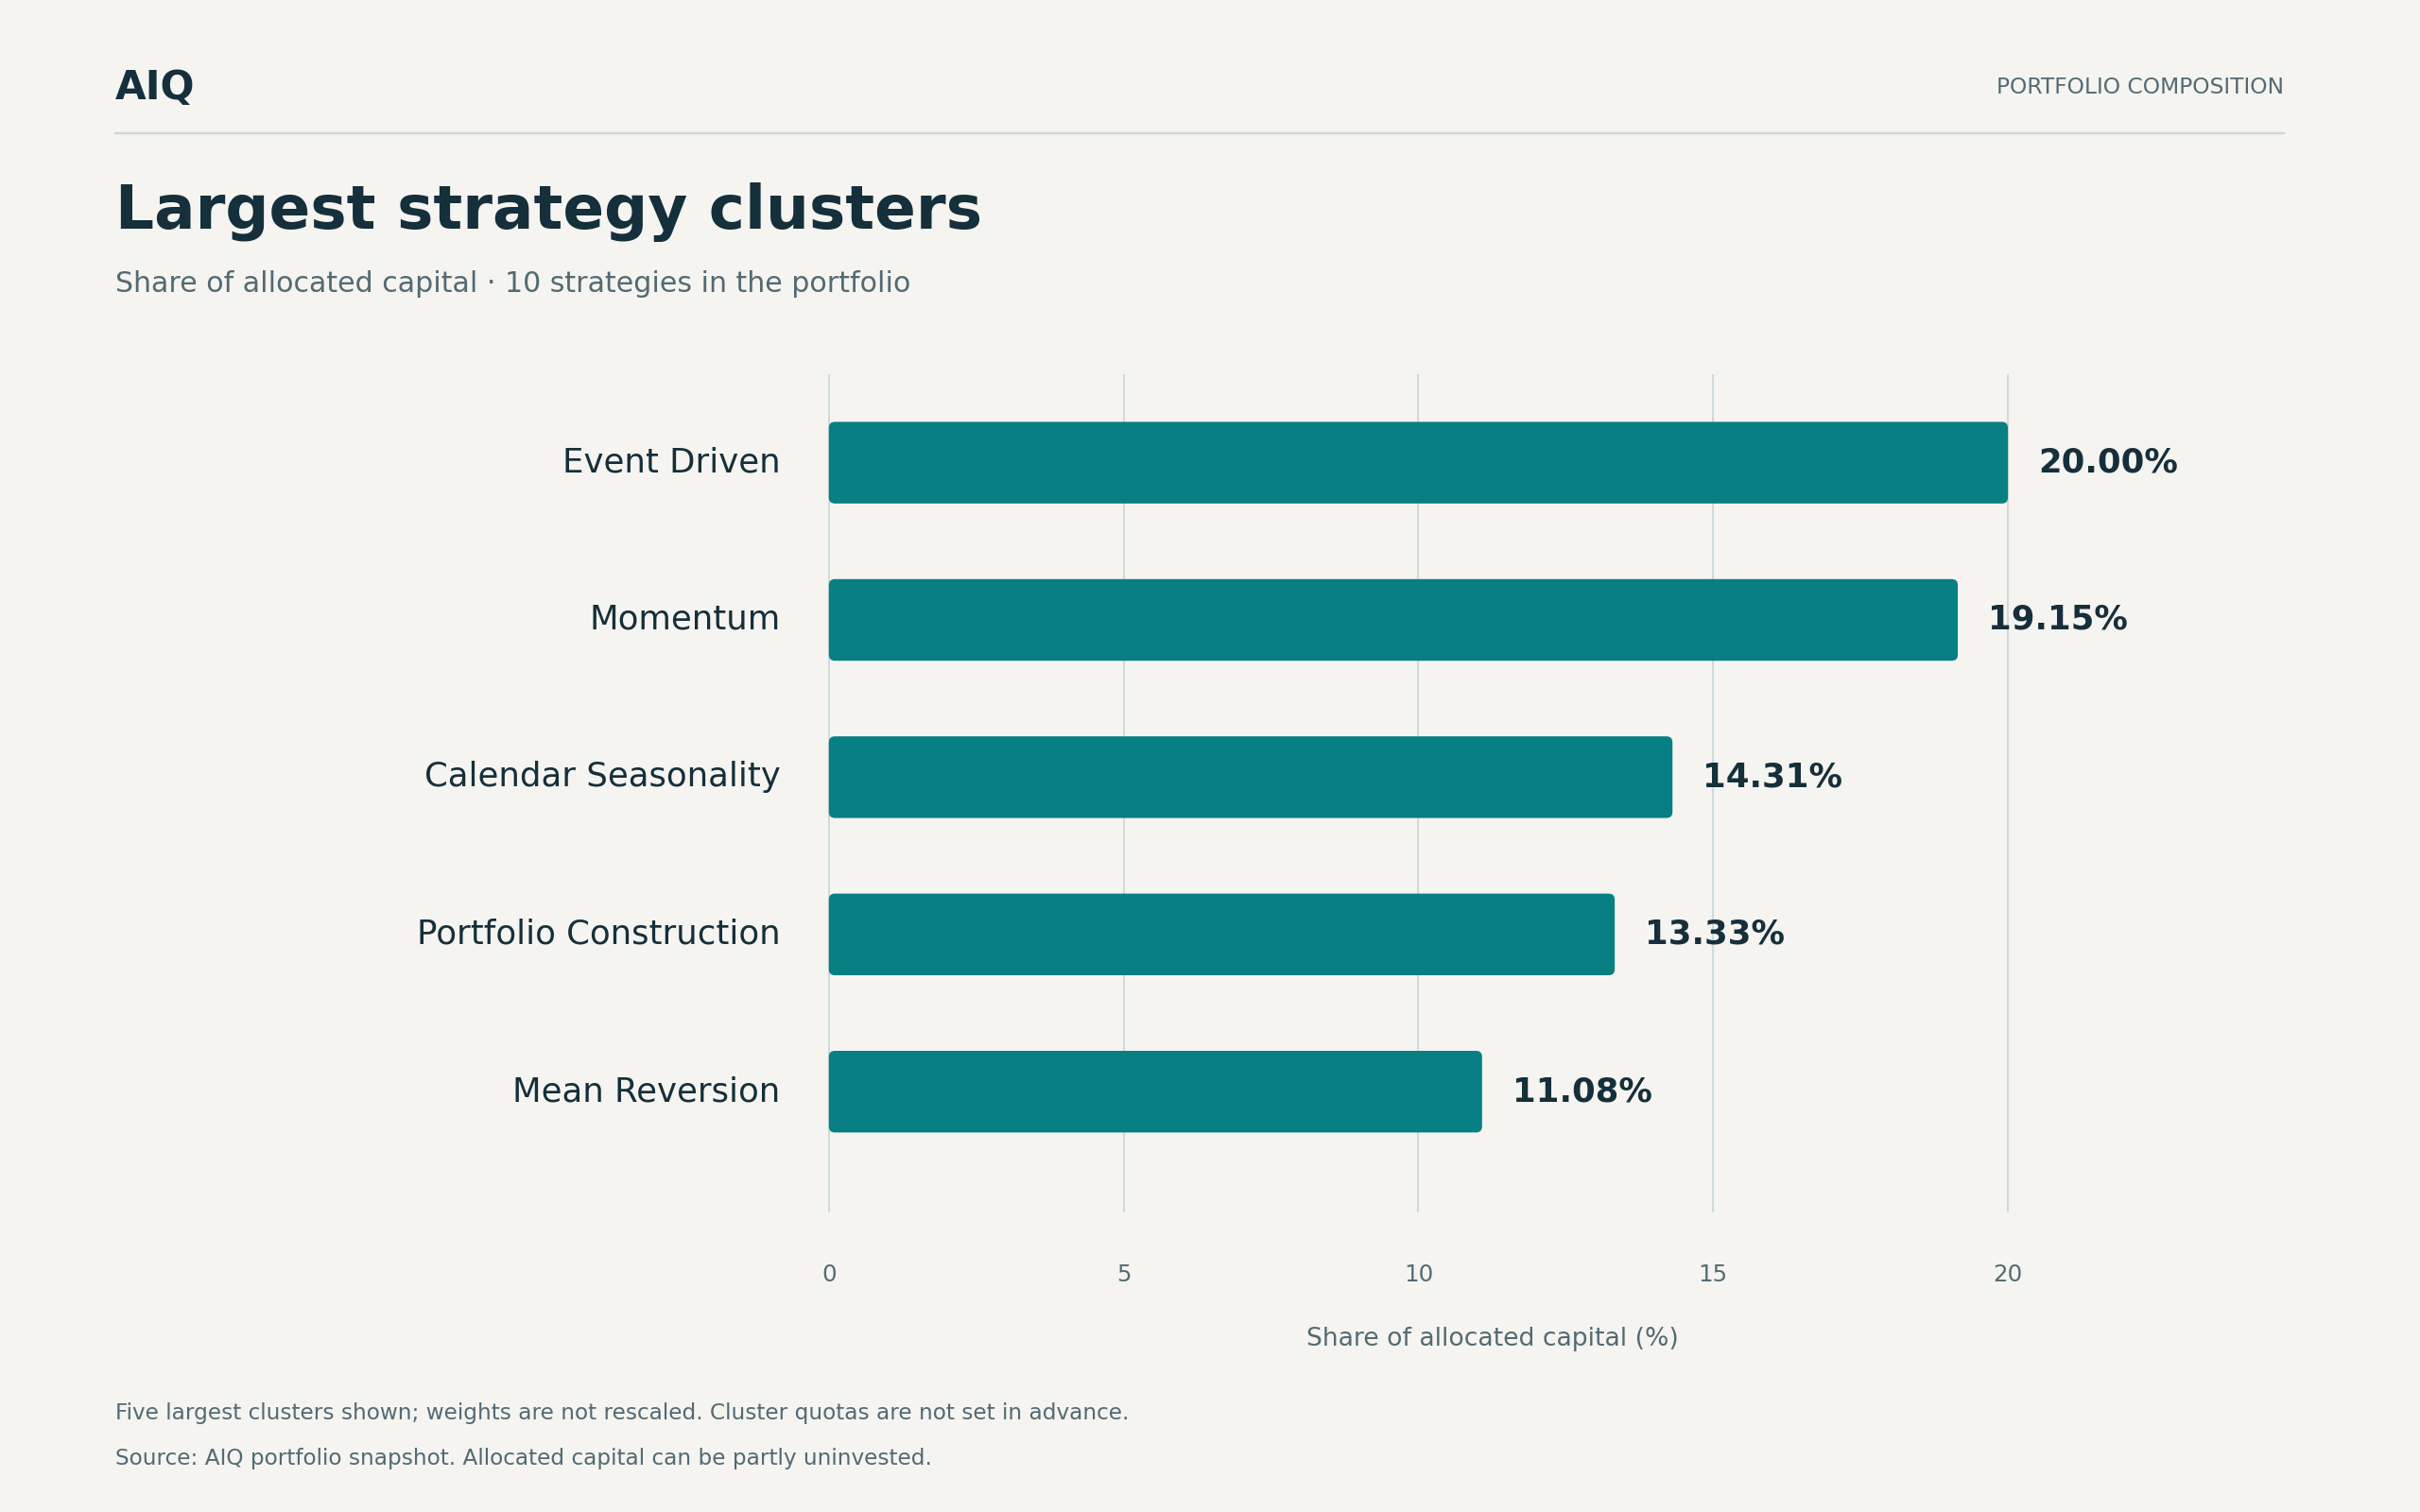
The portfolio also includes Fundamental Event, Reversal and Robust Optimization strategies. We do not set cluster quotas: each cluster's share is the sum of its strategies' calculated weights. Strategies in different clusters can still be highly correlated, and the weight calculation accounts for this.
We evaluate the procedure using a monthly walk-forward backtest beginning on January 1, 2023, after the initial screening period. Before each monthly segment, we calculate the composition and weights using the preceding three years. We then measure how that allocation would have performed in the following month, advance the window and repeat.
Strategy weights in the portfolio model remain fixed during each month, while the strategies continue to open and close positions under their own rules. The portfolio's daily return is the weighted sum of their daily returns. These monthly segments form the full performance history, with a new allocation at each monthly rebalance.
The baseline Max Sharpe backtest covers January 3, 2023 through July 31, 2026: 898 trading days across 43 monthly segments.
Metric | Result |
|---|---|
Sharpe | 2.13 |
Maximum drawdown | 3.8% |
Average number of portfolio strategies | 11.3 |
Average number of candidates passing the monthly screen | 62 |
The monthly candidate count fell as low as 35 after screening. These are historical simulation results with monthly recalculation of composition and weights. Each backtest run starts with a fixed candidate pool; newly added library strategies enter subsequent portfolio builds. We track simulated results separately from live trading results.
We also tested the selection's sensitivity to an additional correlation filter. In a separate experiment, we removed highly correlated strategies before optimization. In the final window, this reduced the pool from 81 candidates to either 66 or 40, depending on the correlation threshold. The final selection of ten strategies remained unchanged. In that experiment, a smaller candidate pool was sufficient to produce the same selection.
For each month, we retain the estimation window, screening results, selected strategies, weights and performance over the following segment. These records let us reconstruct each allocation and compare its estimated characteristics with the results after rebalancing.