To explain the pipeline, we'll follow Hybrid Overnight Momentum with Intraday Extension Fade, a strategy from our research catalogue that combines overnight return persistence with an intraday reversal signal.
The strategy ranks liquid U.S. stocks for long and short positions held from one close to the next. Turning that idea into a backtest means specifying how the signals interact, which stocks qualify, how positions are sized and when each input is available.
AI Quant Forge makes those choices explicit, generates and checks the implementation, and records the historical result.
Language models interpret research, formalise rules, write code and review its logic. Conventional software loads data, runs the historical test and calculates performance from its outputs. We keep those outputs with the specification and code so that a researcher can check how a reported result was produced.
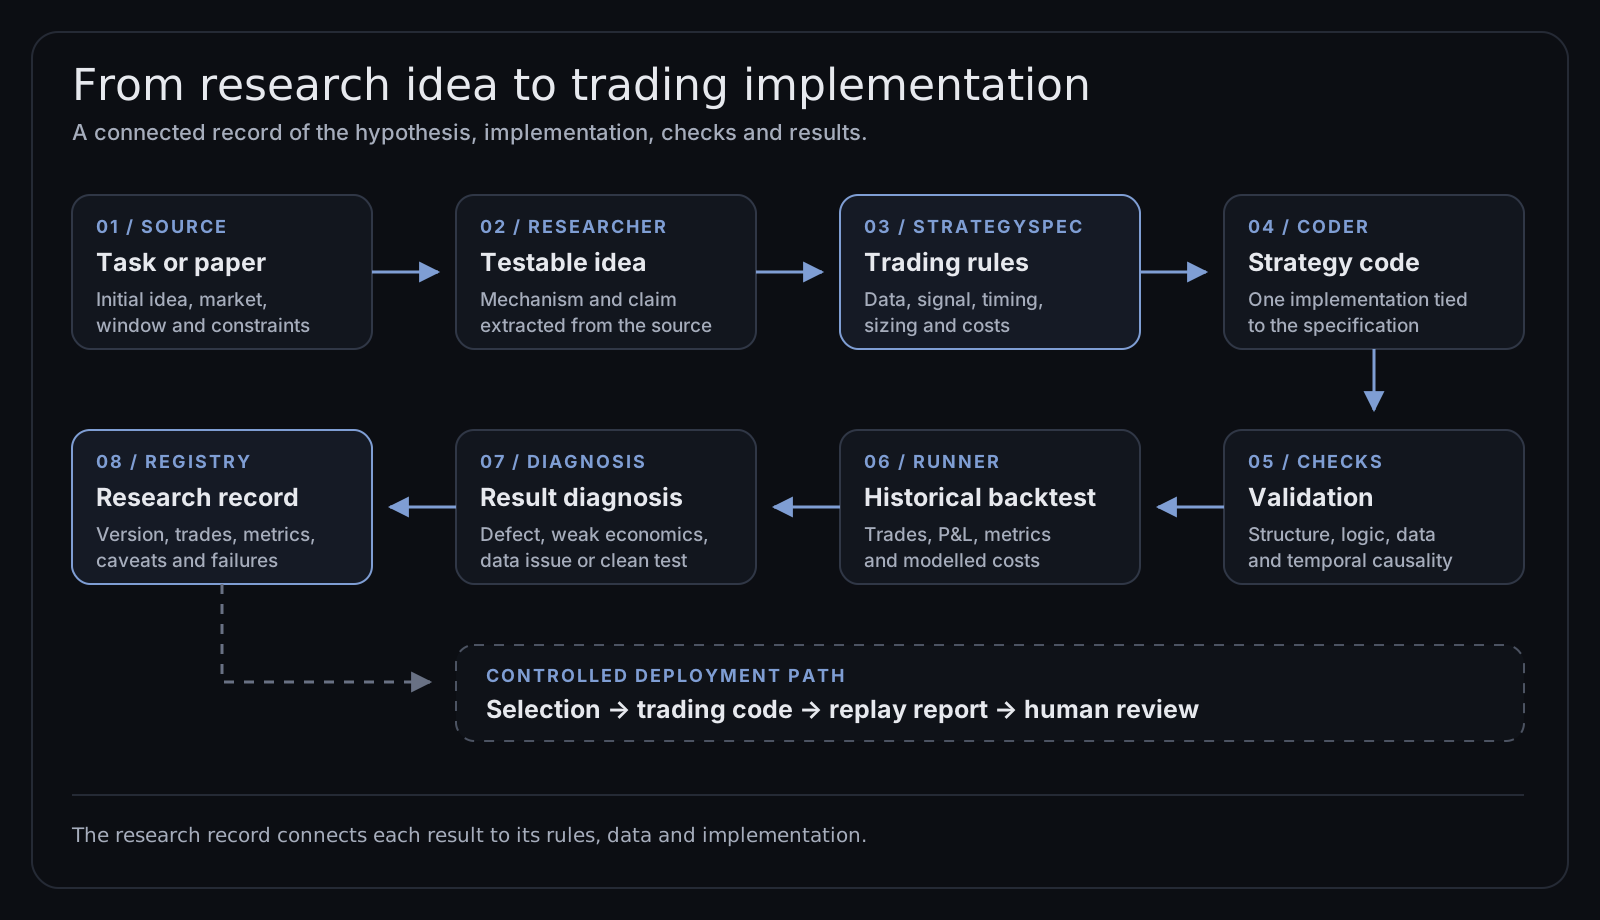
1. Identify a hypothesis that can be tested
The starting point is a research task written by a person or a hypothesis extracted from an academic paper. The underlying question might be whether returns outside regular trading hours persist, whether a volatility measure can help control exposure, or whether a published signal survives trading costs.
For ideas drawn from papers, discovery begins before strategy development. The research process screens abstracts, examines relevant full texts and extracts the proposed mechanism, instruments, signal and supporting evidence. It also distinguishes strategy variants: a result reported for one configuration should stay associated with that configuration.
The next question is whether we have the instruments and data to test the mechanism. Substituting an ETF for a futures contract may be a reasonable new experiment for some momentum ideas. It would change the research question for a strategy whose return depends on futures carry or the shape of the futures curve. The system records that change of scope, or explains why the proposed test cannot proceed.
2. Turn the idea into a specification
The research agent writes a structured strategy specification: the instruments, data, signal, sizing, entry and exit rules, timing, test period and costs. We use it to settle the choices that a short description leaves open.
The user chooses how many specifications to generate for each research task. For an already defined algorithm, one or two may be enough. A broader request, such as “explore momentum strategies in stocks,” can use more specifications to cover different signals, lookback periods and portfolio rules. Each variant receives its own specification.
In this case, the score combines five- and twenty-day overnight returns, the proportion of positive overnight returns over twenty days, and a penalty for unusually strong positive intraday moves. Separate entry filters select up to twenty longs and twenty shorts. The specification also defines volatility-adjusted sizing and daily rebalancing at the close. These choices turn two broad ideas about price behaviour into rules that the implementation can be checked against.
For a paper-based strategy, a review agent compares the specification with the original method: formulas, normalisations, parameters, sample dates and the chosen variant. A missing coefficient or reversed sign can change the signal. An extra filter can exclude exactly the market conditions the paper intended to study. All three can leave the code looking plausible.
By default, this stage allows up to three audits and two rounds of corrections, stopping earlier if there are no remaining findings or no applicable correction. The review is advisory: unresolved findings remain attached to the specification. Necessary adaptations, such as changing the sample because of data coverage, are recorded with the claims they affect. Researchers can revisit those findings when assessing the results.
3. Check the data required by those rules
The pipeline checks whether the specification requests valid fields, dates and instruments, and whether the required historical observations can be loaded. Coverage checks consider the traded universe and any additional datasets used to calculate signals.
If the check confirms that the specified universe has no usable observations, the build stops. Partial coverage produces a warning. If the check itself cannot establish whether the data are available, it records that uncertainty for review.
For this strategy, an overnight return needs the current open and the previous close; an intraday return needs the current open and close. Substituting a close-to-close return would blend the two periods and change the signal. The specification calls for skipping a trade when a required price is missing.
Historical membership matters too. A stock that qualifies for today's universe may not have qualified five years ago. Price adjustments, publication timestamps and missing observations also need attention. A successful data load answers the availability question; these further checks determine whether the inputs are appropriate for the historical decision being simulated.
4. Generate and review the implementation
The coding agent receives the completed specification and the data catalogue. It plans how to construct the signal and trades, then writes an executable implementation using the platform's trading and data interfaces.
The catalogue tells the agent which datasets exist, how instruments are identified and which series can serve as indicators rather than traded positions. Each historical run is associated with its code version and parameters. If a result looks unusual, we can return to the implementation that produced it.
Software checks look for structural errors and known failure patterns. A review agent compares the code with the specification, allowing one correction pass. A separate bug review follows the strategy from data loading through signal calculation, sizing, execution and trade recording.
Consider what this review needs to catch in the hybrid strategy. The code could treat a positive intraday extension as a reason to buy, reversing the intended penalty. It could also close every position at the open even though the rules specify close-to-close holding. Either produces a different strategy from the one specified. Critical findings in the bug review can trigger up to two repair attempts, each followed by another review.
5. Respect when information becomes available
For the hybrid strategy, the specification defines close-to-close holding and daily rebalancing at the close. The platform’s market-on-close convention assumes signals are measured near the close and orders are submitted to the closing auction. The timing review must establish that the historical implementation uses inputs available before order submission.
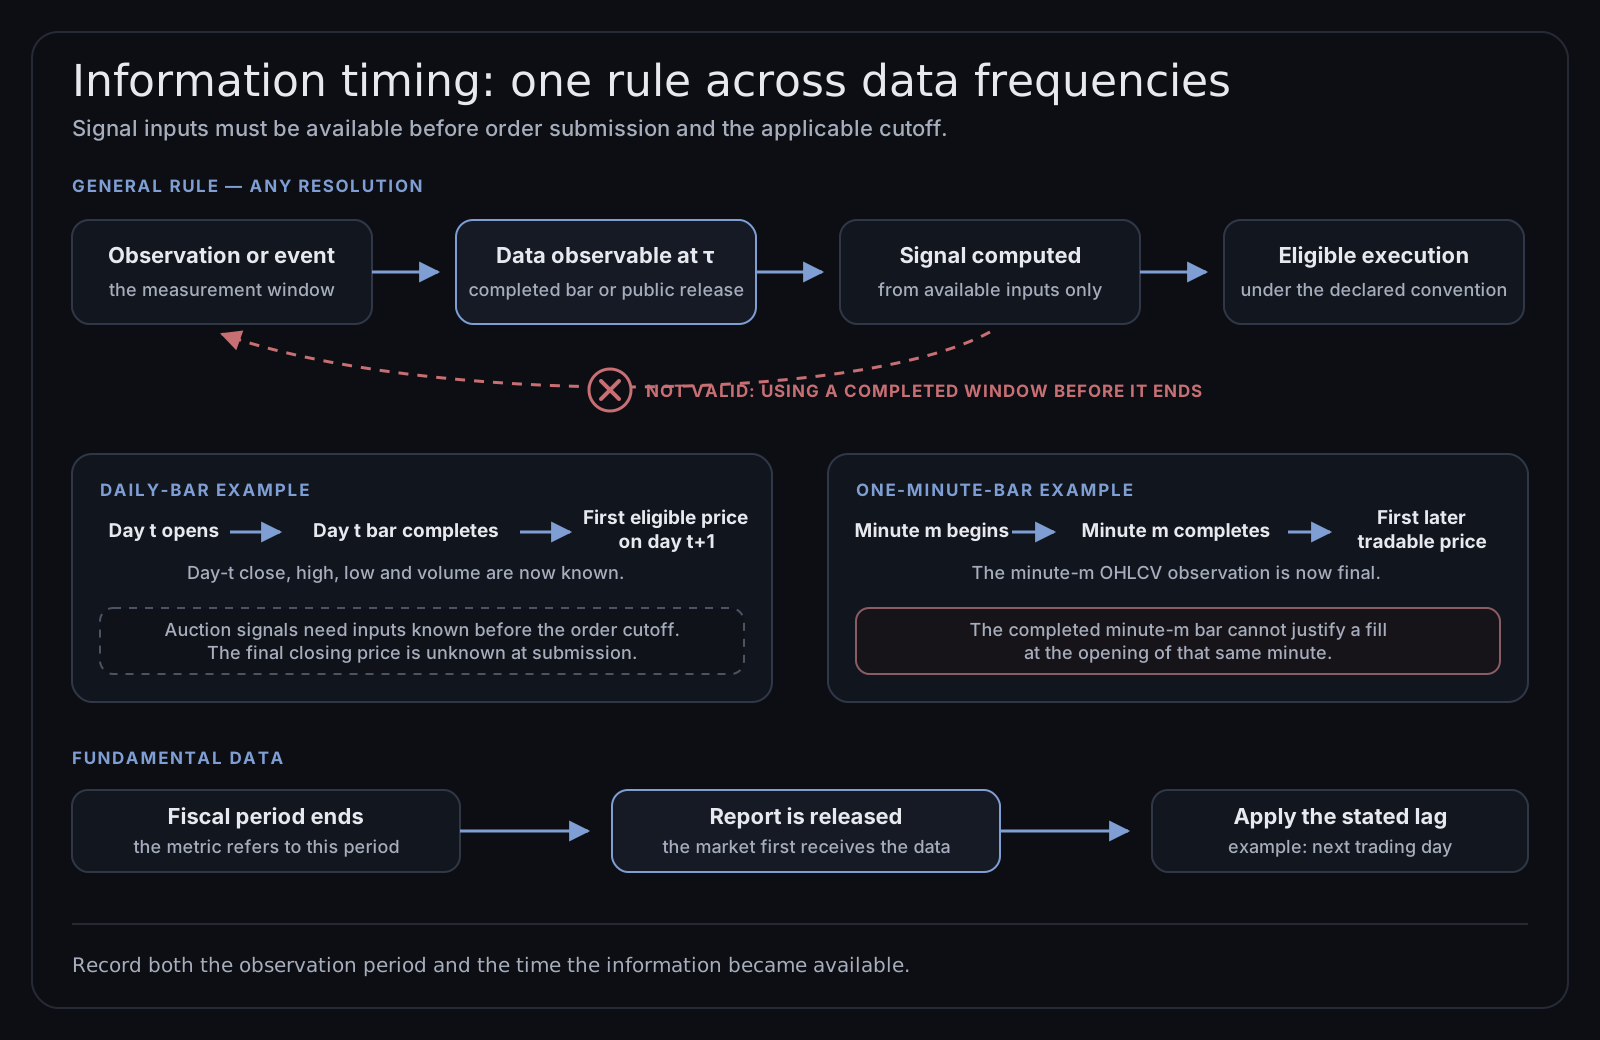
We apply the same ordering principle to daily, minute and event-based data: inputs become observable, the signal is calculated, and execution follows.
For a one-minute interval from 10:31:00 up to 10:32:00, the final high, low, close and volume become available only once the interval has ended and those data have arrived. A signal using them cannot justify a fill at the beginning of that minute. The first eligible execution must follow signal calculation and any modelled latency.
The hybrid strategy’s intraday signal makes this distinction consequential. A price observed shortly before the close and the final auction price are different inputs. A closing-auction order requires its signal inputs to be available before the applicable order cutoff; the market-on-close convention cannot make the final closing price available in advance.
Fundamental data follow publication time. A quarterly figure refers to a reporting period but becomes usable only after its release and any required lag. The current research rules apply a next-trading-day lag to fundamental information.
The pipeline scans for common timing errors and can repair some open-versus-close inconsistencies. This scan is heuristic; the review of the full signal and execution logic remains necessary, particularly when combining sources with different publication schedules.
The pipeline scans for common timing errors and can repair some open-versus-close inconsistencies. This scan is heuristic; the review of the full signal and execution logic remains necessary, particularly when combining sources with different publication schedules.
6. Run the historical test and diagnose the outcome
The historical runner executes the recorded implementation over the specified interval. It produces trades, a daily profit-and-loss series, capital-usage figures, performance metrics and an execution log. Metrics are calculated from the run's outputs under the stated cost assumptions.
The test protocol determines how to interpret those numbers. In the automated paper-based route, the initial historical test excludes a recent segment. Operator-defined tasks use their selected interval. We therefore describe the validation performed for the particular experiment; a completed backtest alone does not establish that walk-forward or out-of-sample evaluation took place.
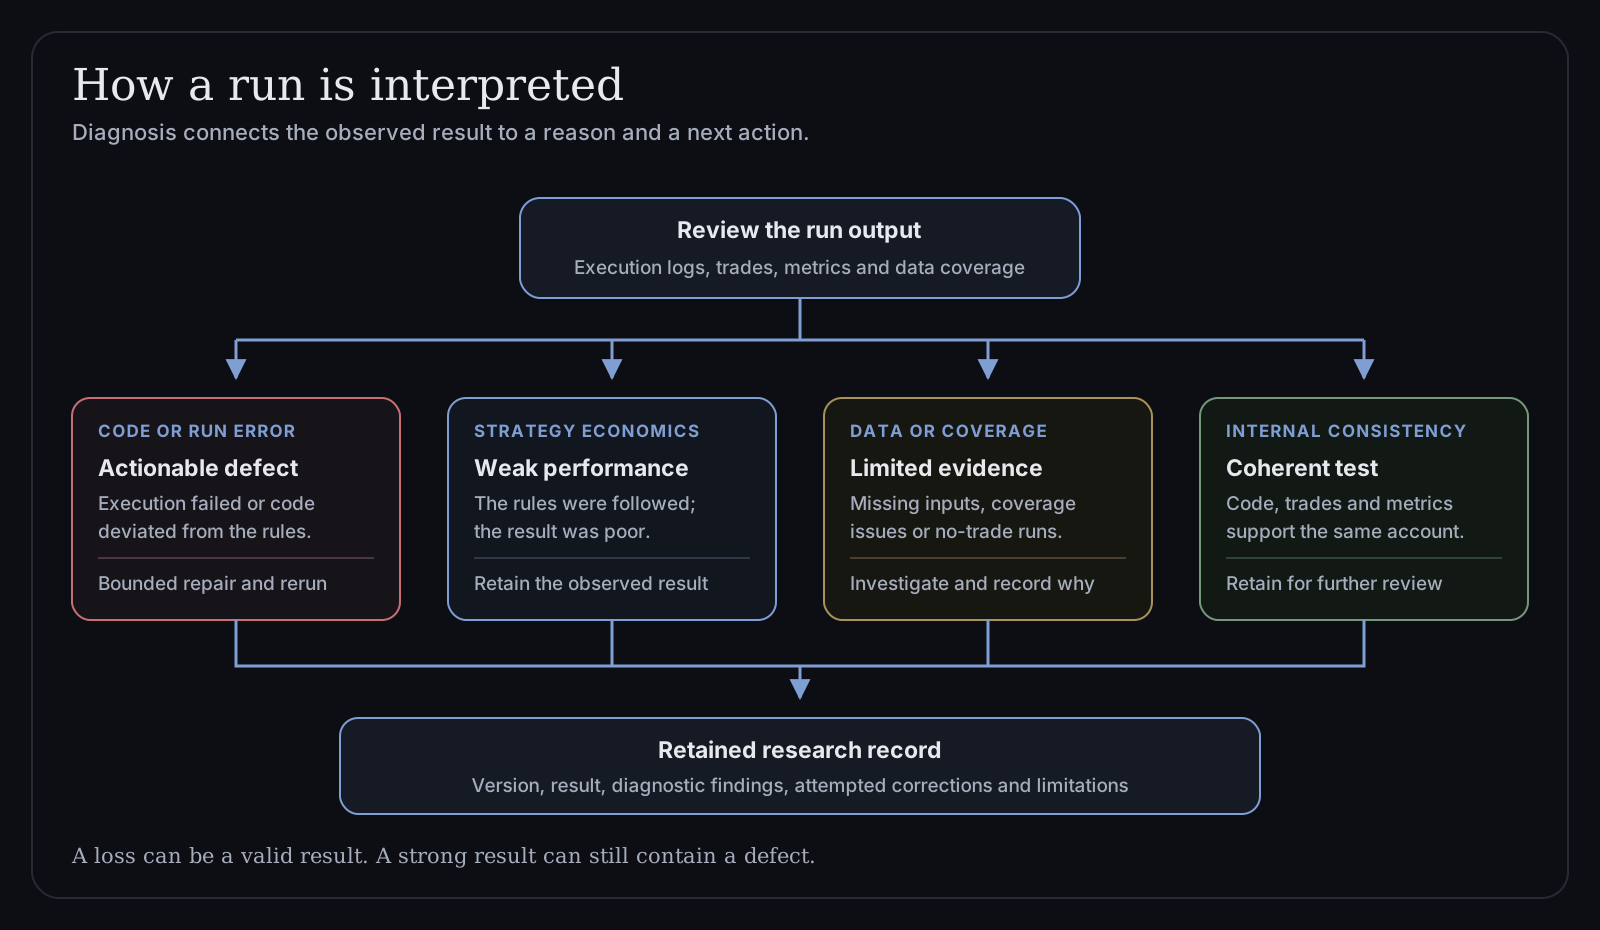
After execution, a diagnostic stage examines the specification, code, trades, metrics and logs together. It distinguishes implementation defects from weak strategy economics, data problems, an internally consistent result and an inconclusive test. Runs that produce no trades are recorded as unsuccessful tests with a reason.
After a failed execution, the runner allows up to three further attempts. An implementation defect found in a completed test can open one correction cycle through the same recovery process; the next completed result is reviewed without starting another cycle. We keep negative results in the research record: a strategy that follows its intended rules and loses money has still answered a useful question. Poor returns alone do not trigger repeated rewriting.
Trading costs can change the conclusion, particularly when a strategy trades frequently. Each run includes only the commissions, slippage and other costs modelled for that experiment. We report its historical figures as hypothetical results net of modelled costs. The methodology note at the end of this article explains the capital basis and return calculation.
7. Retain an inspectable experiment
We keep the specification, code version, run parameters, trades, P&L and review findings together. The strategy card presents the rationale, rules, assumptions and results; the underlying records let a researcher investigate beyond the summary chart.
Return calculations include modelled commissions that approximate broker charges. These are configured in the results-analysis block and applied when calculating performance from the recorded trades. Reported returns are net of those commissions.
A “no strategy” outcome can mean five different things: the idea was too vague to test, the required instruments or data were unavailable, the specification failed validation, the code failed to run, or a valid test found no evidence of an edge. We retain the reason, because an unresolved research question, a technical failure and a negative result call for different next steps.
The hybrid example shows what a reader can check. Its Run diagnostics section checks the dates and number of observations in the saved daily return series, then recalculates total return, Sharpe, volatility, maximum drawdown and CAGR alongside the stored values. For this run, there are 1,259 observations on 1,259 distinct dates, and the recalculated figures match the reported metrics.
This checks the calculations against their recorded inputs; data and execution assumptions require their own review. If the figures disagree, the saved series and calculation conventions give us somewhere concrete to start investigating.
8. Prepare selected strategies for trading
For a strategy selected for deployment, the system produces a separate implementation for live execution. It has to work with incoming data and the account as it stands: positions may already be open, and earlier trading decisions affect what should happen next.
Preparing this code involves reconciling positions, recovering strategy state and scheduling order submission. These functions let the strategy continue across successive sessions and operate against an existing account. The research rules now have an implementation intended for production use.
The deployment version is then replayed over historical data with order submission disabled. Its trade events are compared with the reference backtest, producing a report of agreement and unmatched events. The current replay process allows up to three runs, with at most two rounds of deployment-code corrections between them.
The current comparison uses trading date, instrument and direction. It measures agreement against an acceptance threshold rather than requiring exact equality. It does not compare intraday timestamps, quantities or fill prices, so it cannot establish minute-level execution equivalence. Completing the replay process and meeting its acceptance threshold are distinct outcomes.
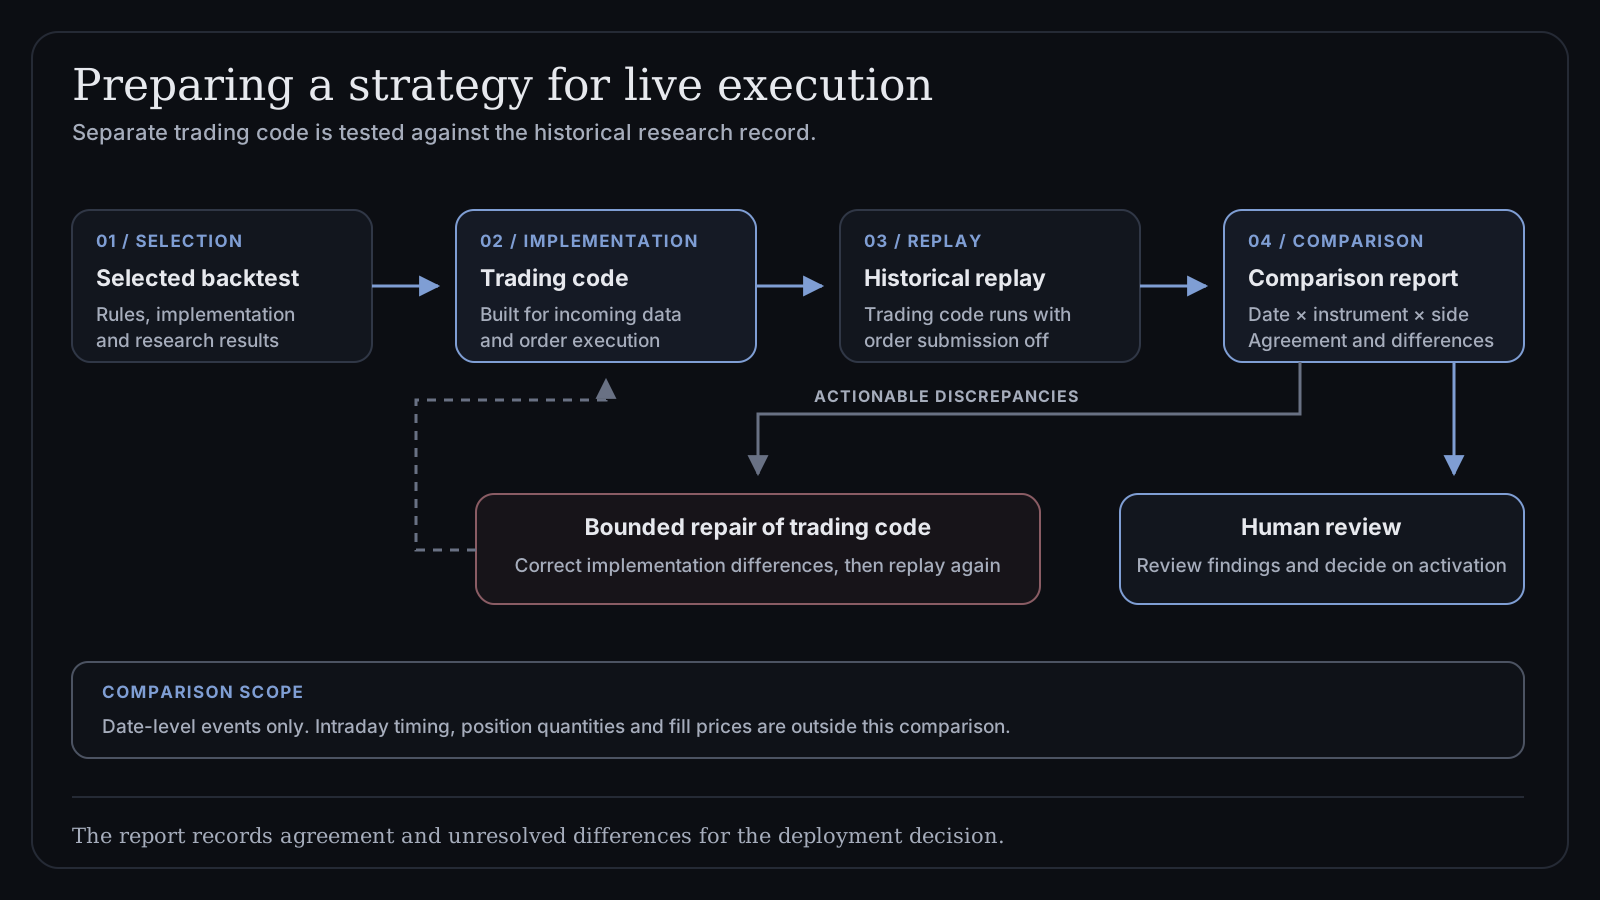
Deployment remains a human decision informed by the research and replay reports. Portfolio selection and sizing also consider the candidate's risks and its relationship to other strategies. Once approved for the relevant environment, the implementation can be used for forward observation or live trading. Historical simulation, replay comparison, paper-account observations and actual trading remain separately identified forms of evidence.
Explore the Hybrid Overnight Momentum with Intraday Extension Fade case study to inspect its trading rules, historical results and the assumptions behind the test.
Methodology note: the research framework's daily capital-normalised P&L is the change in account value divided by initial allocated capital. Its cumulative result sums those increments; it does not assume automatic reinvestment. Annualised figures should be interpreted using the convention recorded for the individual run.